Long-Term Perspective

Funded Status and Discount Rates

Source: Fidelity Institutional Asset Management, Bloomberg, FTSE, as of 3/31/22. For institutional use only.
Market Commentary
- Funded statuses gained roughly 1.4% in Q1 2022 continuing their positive momentum after gaining approximately 10.7% last year (based on our 60/40 proxy portfolio).
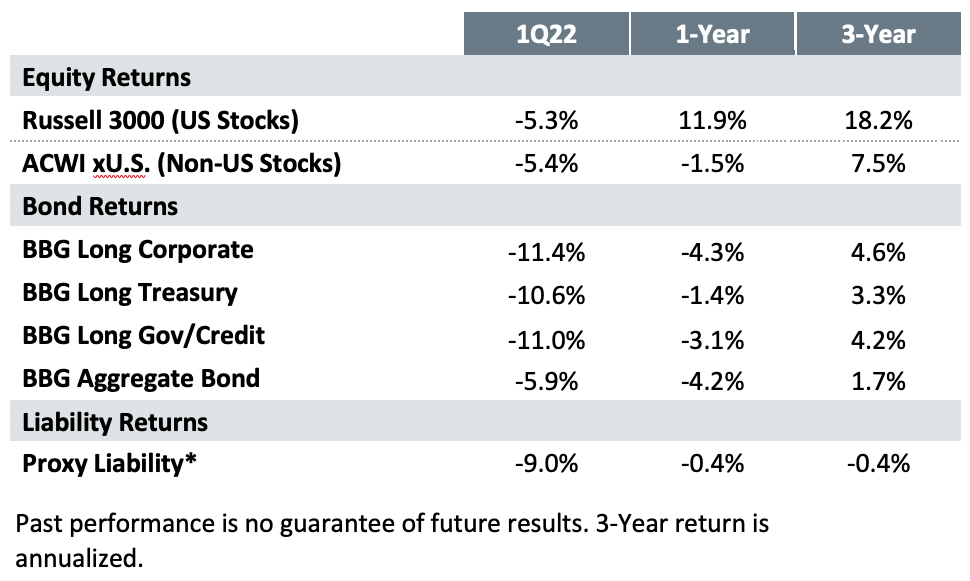
- Rates were on the rise. Liability discount rates rose an estimated 0.8% in the first quarter. This pushed down the present value of pension liabilities by approximately 9.0% (based on our proxy liability with 12.5 duration).
- Equities also lost value but in general held up better than the typical liability. Global equities returned -5.3% for the quarter. There was not wide dispersion between U.S. and non-U.S. equities. However, over the past few years U.S. markets have easily outpaced non-U.S.
- Treasury rates saw meaningful increases across maturities. Shorter maturity rates rose further than long rates, flattening the yield curve.
- Rate moves reflected the Federal Reserve’s shift in communication in December. They acknowledged inflationary pressures were persistent. They also clearly signaled an end to extreme policy accommodation. They only raised the Fed Funds rate by 0.25% in the first quarter. However, the rise in rates across the yield curve indicated the market expects the Fed to follow through on their plans for 7-8 quarter-point increases this year.
- Overall, it was quarter of heightened volatility across financial markets. The horrific conflict in Ukraine exacerbated inflationary pressures. The removal of Fed accommodation may keep volatility elevated throughout the year.
Pension News
- Secure Act 2.0 Passed in the House (now with the Senate):
— Gradually increases age for Required Minimum Distributions (RMDs) from current age of 72 to 75 by 2032.
— Allows plan sponsors to not recoup overpayments to retirees.
— Directs DOL to establish a federally run “lost and found” database for retirement accounts.
— Increases the mandatory cashout limit from $5,000 to $7,000. - Proposed RMD Regulations issued to clarify changes made by the SECURE Act 1.0.
— Compliance required for 2022; good faith compliance applies for 2021
— Expect regulations to be finalized later this year after the comment period ending in May
- Still on the horizon: Limiting the PBGC variable-rate premiums to the 2018 level of 3.8% of the unfunded vested benefits with no future indexing was included in a prior version of SECURE 2.0 in the Senate but not in the one passed by the House. Will the Senate add it back in to the final bill?
- 2021 Pension Risk Transfer market hit an all time high, estimated at $38-40 billion
Pension Spotlight
- With gains in funded status for both the quarter and the past year many plan sponsors will be considering de-risking to preserve some of the gains.
- With interest rates up meaningfully since year end and well above the lows they hit in 2020 there is more two-way risk in interest rates from here.
- No matter the level of rates, we believe funded status should be the primary driver of a plan’s risk level. As funding improves risk should be systematically reduced.
— There is less to gain and more to lose as a plan’s funded status improves. The most efficient way to reduce downside risk to the funding level is through a targeted long bond allocation (aka, LDI).
— With rates well above all time lows LDI is like having insurance if they fall back to lower levels. Cash or shorter bonds have less volatility in isolation but they increase funding volatility relative to bonds that better match the liability.

Source: Fidelity Institutional Asset Management, Bloomberg, FTSE, as of 3/31/22. For institutional use only.
*Discount rate based on FTSE Pension Liability Intermediate Index (approximately 12.5-year duration).
Market Commentary
Risk-off sentiment prevailed throughout most of the quarter. Concerns that persistent inflation would force tighter Fed policy weighed on stock prices and widened credit spreads. The outbreak of war in Ukraine exacerbated these concerns, although risk markets did stage a rally in the final weeks of the quarter.
Ultimately, equity returns were negative in the first quarter but did not fall as much as long bonds and liabilities. The decisive shift in Fed messaging toward tighter policy was quickly priced in across Treasury markets during the quarter. This pushed the yield curve higher and flatter. Meanwhile, weakness in risk markets drove credit spreads wider, further elevating corporate discount rates. The result was the lowest quarterly returns for Long Corporate indices since 3Q 2008.
Looking ahead, considerable monetary tightening has been priced into rate markets. The direction forward for markets and the economy will be driven in large part by inflation and employment data, as well as the Ukrainian conflict.

Source: Fidelity Institutional Asset Management, Bloomberg, FTSE, as of 3/31/22. For institutional use only.
*Proxy liability return based on FTSE Pension Liability Intermediate Index (approximately 12.5-year duration).
Longer-Term Perspective
Historical Returns


Interest Rate Levels

Hedging Considerations
Within investment grade, performance by credit quality can impact the effectiveness of hedging portfolios. A well- diversified LDI portfolio typically includes A/BBBs given the size, liquidity and yield advantage of the category relative to AA/AAAs.
However, liability discount curves typically only contain AA-or-higher rated bonds. Therefore, hedging portfolios also typically include Treasuries to balance this risk.
This quarter higher quality segments of the bond market outperformed given generally risk-off market sentiment. As shown below, AAA and AA bonds outperformed A and BBBs. All investment-grade categories trailed Treasuries. Over the past year, however, BBBs have performed relatively well.
Looking ahead, the macro environment has become more challenging with less accommodative policy and heightened geopolitical tensions. However, corporate profit is strong and leverage declining. This should limit downgrades and defaults in the lower quality end of the investment-grade market.
Credit Returns vs. Treasuries


Source: Fidelity Institutional Asset Management, Bloomberg, FTSE, as of 3/31/22. For institutional use only.
Strategic Asset Allocation Considerations
As illustrated in the chart below, traditional strategies that focus on total portfolio outcomes without consideration of the liability—such as the 60% Equity/40% Aggregate Bond (Core)— are often less effective than strategies with a bond allocation focused on more efficient liability hedging mandates such as Long Government/Credit (LDI) strategies.
The 60/40 LDI dynamic approach incorporates de-risking triggered by funding gains. As illustrated below, it provides a more stable funded status. While dynamic de-risking provides less upside in bull markets like the past few years it also better protects funding in times of market stress – as illustrated in the Mar/Apr period in 2020.
With plans enjoying strong funding gains over the past year many sponsors have been assessing the need to de-risk. Many of our conversations have been on how to de-risk as much as when or why. As plans move along the glide path there becomes an increasing need to customize the bond portfolio to ensure risk is hedged specifically to the plan’s unique liability.
Funded Status of Illustrative Plans


De-risking pension plans through shedding pension liability is often thought of in three major areas: lump sum cashouts to former participants, purchasing annuity contracts for in-pay participants, and full plan terminations. With the passage of legislation in 2019 lowering the age for in-service distributions from age 62 to 59 ½, a new window of opportunity for risk transfers has opened and is gaining more traction: offering lump sums to active participants at least age 59 ½.
Why offer lump sums to these participants? A few key reasons:
– Opportunity to reduce DB plan risks/costs– Reduced PBGC premiums
– Participants can consolidate retirement assets
– May increase 401(k) assets under management if funds are rolled over
– Improve retention by giving earlier access to retirement funds without having to quit working
Adding this feature can be done as a permanent plan feature or through a “window” approach where it is offered for a limited time. An example of a plan that may want to closely consider offering this feature is a frozen cash balance plan with a fixed interest crediting rate. The current carrying cost of the liability may be greater than the account balance, which means a cashout is an immediate improvement in a plan’s funded status.
There are other considerations for plan sponsors considering this option – funded status, PBGC variable premium levels, and current de-risking strategy. A change of this nature will impact a plan’s projected cash flows and would need to be reviewed along with the current LDI strategy for the plan.
Contact information
Michael Jarasitis, CFA, Institutional Portfolio Manager
603-791-1354
michael.jarasitis@fmr.com
